Visualising the Gender Breakdown of the Japanese Government
March 04, 2023
4 min read
With the Women's March Tokyo coming up in just 4 days (March 8th, 2023) I wanted to make some kind of placard with recent gender breakdown data for the Japanese government.
Gender Equality Bureau
The government has a Gender Equality Bureau which publishes various statistics, including gender breakdowns (binary only) for the lower and upper houses.
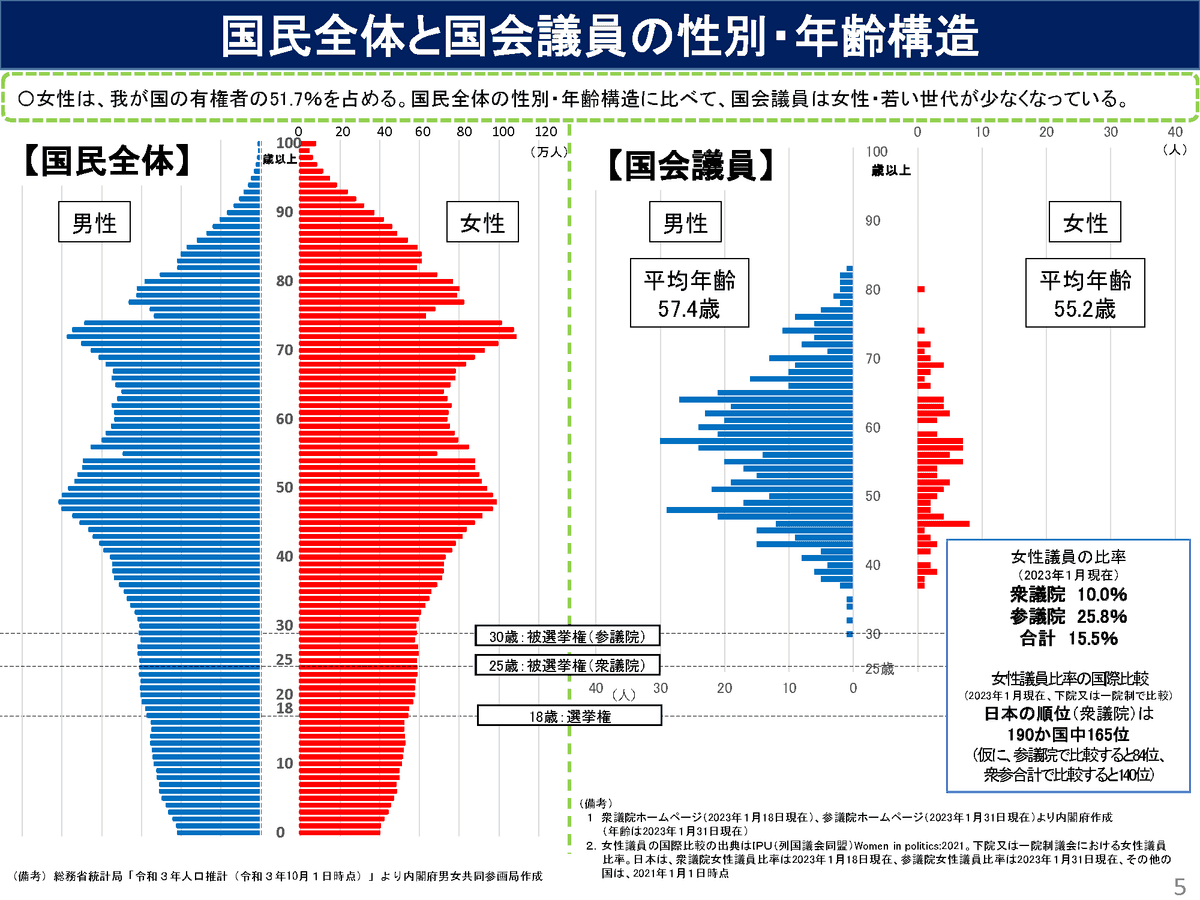
There's a nice (if complicated) visualisation of the general population gender breakdown vs the government included in the 'Current Status and Challenges of Gender Equality in Japan' report (note that the English version is only available up to 2022 at the moment):

But... honestly who wants to see this on a sign in a protest?
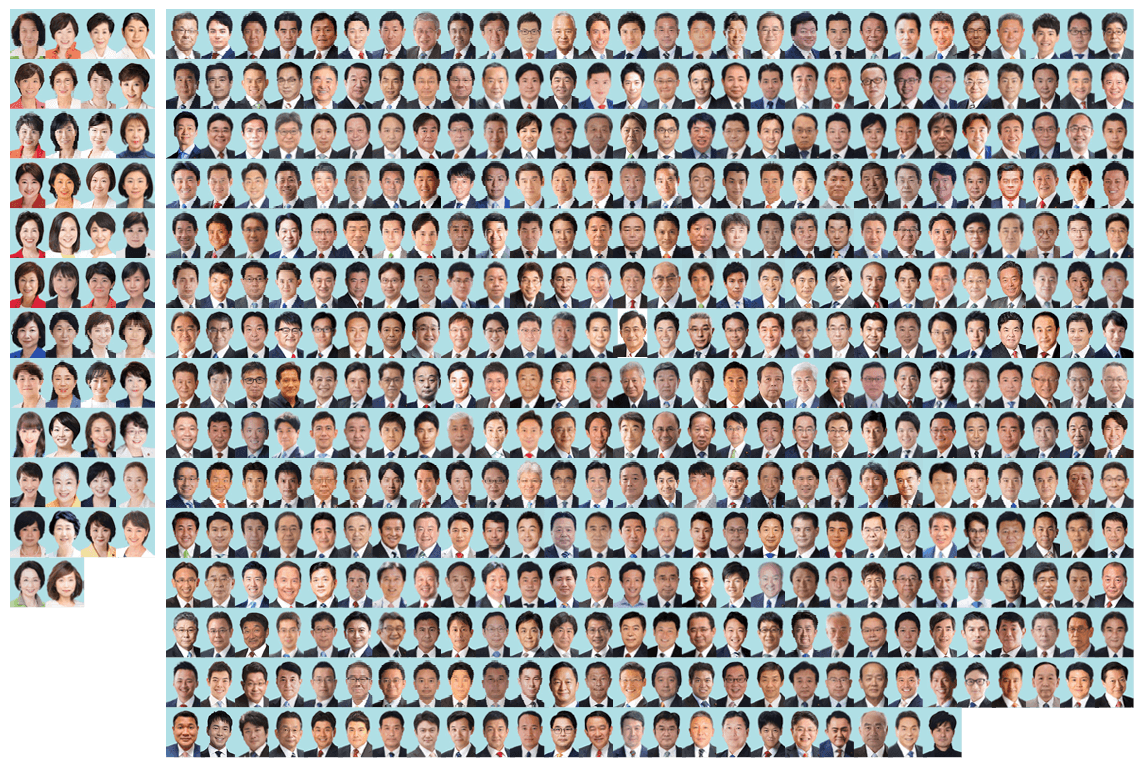
I wanted to visualize what this government actually looks like.
Getting the Official Profile Pictures of the Government
There are official websites for both the lower and upper houses of the Japanese government. Each is a bit different, but both have a list of all the members - photos included!
Unfortunately, both sites didn't have any kind of API, but this wasn't my first web-scraping rodeo, so it didn't take too long to throw together a few bits of Python to grab all the photos.
You can find all the code I used for this on GitHub. I'm not a Python expert though - this is incredibly hacky and probably not that useful to anyone else 😅
The upper house actually prefixes all the profile picture alt texts with a mr/ms, making the categorisation a bit easier. The lower house doesn't, so at first I tried to use image recognition.
Face / Gender Prediction
I tried using cvlib for facial recognition, but it didn't work very well. I think this is because the images are passport-like. The frontal face detector from dlib worked well, but I couldn't find a gender predictor model that was trained on Japanese faces and eventually gave up (the model available in cvlib was a disaster and is presumably trained on western faces).
Ultimately this was a dead end, but it was interesting trying to get it to work.
Some More Problems 🙃
I think it's time to talk about some of the problems with this whole project.
For starters, the way we should probably report on gender is through self-reported gender identities, but that's not the lens through which statistics like this are reported on at the moment. As such, we normally just have 'male'/'female'.
Secondly, I'm haven't looked at this through a lens of intersectionality. There are definitely other axes of oppression that are important to consider.
Manually Guessing Genders of the Lower House 🫠
Since I had the profile pictures of all the members of the lower house, and the total counts of female/male, I wrote a quick Python program to display the images and allow me to categorise them.
Dystopian sidenote: Tinder for choosing political representatives? 🤔
I checked the final results against the counts I had from the equality report and they matched. I do hope that I haven't misgendered anyone through this process though - I will edit this post if notified of any mistakes.
Visualising the Lower House
Without further ado, this is what the lower house looks like:

Pretty wild, right? 😳
I pulled this together with Adobe InDesign (installed it for the first time just for this project since it was the only thing I could find to make a photo grid easily 😅). The images are a bit downsampled so they don't look great, but it gets the point across I think.
I'm still working on the actual placard for the march (need to add some more global-oriented things) but will update with photos from the event when it's over.
Hope to see you there! ✊
Thanks for reading! Feel free to reach out to me (@MorrisonCole) if you have corrections, suggestions, comments, hatemail etc.
